Market analysis
PSA 9 vs. PSA 10 Pokémon cards
A comparison of grading premiums, population figures and completed sales.
Proof / Selected work & experience
Published specialist writing, practical survey-system experience and an example from my statistical mapping workflow.
Published work
Research and explanations that help readers understand a product, assess a market or start collecting.
Market analysis
A comparison of grading premiums, population figures and completed sales.
Product guide
A guide to the anniversary set, its cards and collecting products.
Collector education
An introduction to collecting, product choices and what to look for.
Survey systems & backend support
I build and modify Survey123/XLSForms and support the technical and data work behind field surveys.
Logic, validation and consistency in how information is recorded.
Sampling and assignments, duplicate detection, GPS checks and backend monitoring.
Clean Excel/CSV datasets, statistical tables, charts, maps and reports.
Backend team contributions to existing systems
Survey-project experience
A survey examining how people obtain cash across communities.
My role: Worked within the backend team supporting the existing survey system and resulting datasets.
Survey-project experience
An exercise documenting existing ward resources and development needs.
My role: Worked within the backend team supporting the existing survey system and resulting datasets.
My development-sector experience includes work through teams implementing survey programmes supported by international partners, including WHO, UNFPA and the World Bank. The work involved agreed methodologies, confidentiality, data quality and reporting.
Statistical table → map
An output from my existing mapping workflow: area-level values joined to boundaries, with labels, a legend and source notes.
All indicator values are fictional. This is a demonstration, not a client dataset.
View the mapping sheet PDF · 1 page ↗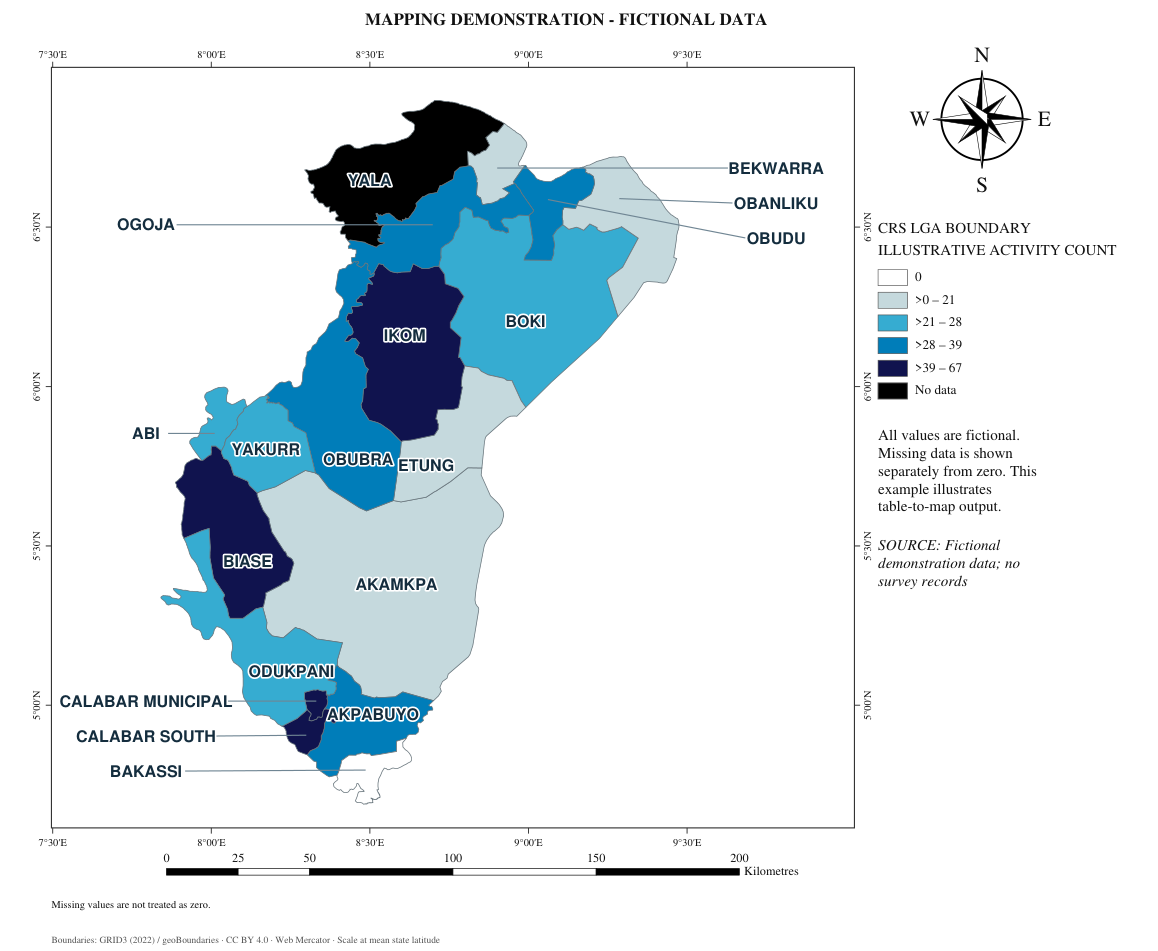
Have a project in mind?
Tell me what you’re working on, the output you need and your intended deadline. We can find a defined assignment and discuss the details by email.
Email John johnebassey88@gmail.comFor survey and data projects, start with a description and an approved de-identified example.